

Two analytical figures appear on nearly every peptide certificate of analysis, and they are routinely conflated. They answer different questions, and neither is sufficient alone.
Mass spectrometry answers: is this the right molecule?
MS measures mass-to-charge ratio, which the instrument converts to a molecular weight. That observed weight is compared against the theoretical weight calculated from the sequence.
If they match within tolerance, the material in the vial is the molecule the label claims. That is identity confirmation, and it is binary in character — it either matches or it does not.
What MS does not tell you is how much of the vial is that molecule. A sample that is 60% target peptide and 40% truncated fragments can still produce a clean identity confirmation for the target.
HPLC answers: how much of it is the right molecule?
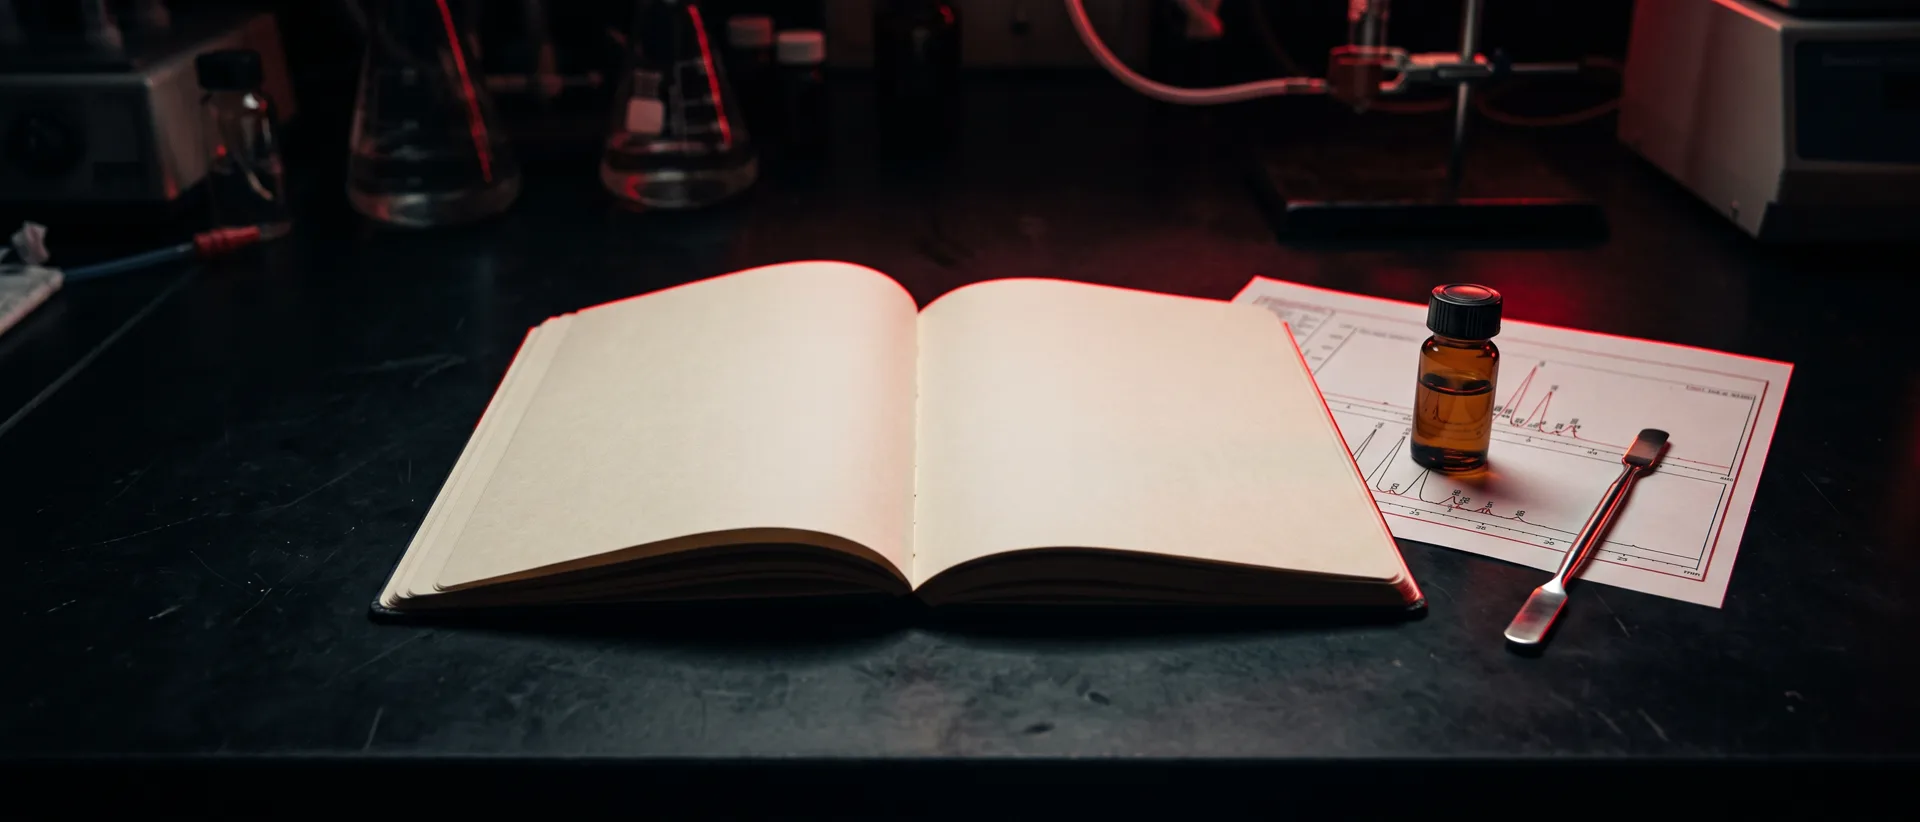
Reverse-phase HPLC separates components by hydrophobicity. The detector reports absorbance over time, producing peaks. Purity is reported as the area of the main peak as a percentage of total peak area, at a stated wavelength.
Three caveats worth understanding:
- It is area percent, not mass percent. Different molecules absorb differently at a given wavelength, so peak area is a proxy for quantity, not a direct measure of it.
- It only counts what elutes and absorbs. Salts, counter-ions and residual water contribute nothing to the chromatogram — which is why a 99% pure peptide can still be a minority of the powder by mass. That is what the peptide content figure is for.
- Wavelength matters. 214 nm detects the peptide bond and sees essentially everything peptidic. 280 nm detects aromatic residues and will miss sequences without them.
Why you need both
| Question | Answered by |
|---|---|
| Is this the molecule on the label? | Mass spectrometry |
| How much of the sample is that molecule? | HPLC purity |
| How much peptide is actually in the vial? | Peptide content / net peptide weight |
A COA with only one of the three leaves a real gap. A COA with all three lets you calculate what you actually have.
Comparing across suppliers
Purity figures are only comparable when the method is comparable. Before treating “99%” from one source as better than “98%” from another, check that both are reverse-phase HPLC at the same detection wavelength, and that both show the chromatogram. A purity claim without a method statement and a trace is not a measurement you can compare against anything.
Aegis Bio provides a certificate of analysis by request for the batch supplied, covering HPLC purity and mass-spectrometry identity confirmation. See the quality and documentation section for what is held on file.